
Australia's houses are shrinking, smallest in 17 years
- By Peter Gordon
- •
- 14 Nov, 2019
Seven years ago, Aussies were building the biggest detached (free-standing) houses in the world. But in the period since, Aussie home buyers have embraced apartments as well as smaller houses on smaller lot sizes.
There are still McMansions being built, but there are fewer of them. Now houses being built in the US are the biggest in the world, around 5 per cent bigger than in Australia.
Only 21 per cent of ACT dwellings in 2018/19 were houses. But those houses averaged 251 square metres – the biggest in Australia. Victorian houses built last year were 246m² - the biggest in seven years.
The average house built in Tasmania in 2018/19 was the smallest in 23 years and at 21-year lows in Queensland. On average, NSW apartments built in 2018/19 were the smallest in 20 years of records.
Houses built in Australia over the past year are still far bigger than those built in the 1980s and 1990s. In fact houses are around 5 per cent bigger than 20 years ago and 25 per cent bigger than 30 years ago.
And that is important when doing comparisons of house prices over time. Not only are houses far bigger than those built in the 1980s and before, but the standard of fit-out today is far superior with higher quality kitchens, bathrooms, floor coverings and inclusions like air-conditioners.
While global statistics on home size are difficult to come by, latest data indicates that Australian homes are the second biggest in the world, behind the US.
The average new house built in the US last calendar year (latest available) was 240.4 square metres (m²), around 5 per cent bigger than in Australia. And US homes (houses and apartments) averaged 201.8m² in 2018, around 6 per cent bigger than in Australia.
In New Zealand the average home built in 2018/19 was 164.4m², around 13 per cent smaller than in Australia.
The UK Office of National Statistics and United Nations indicate that the average floor area of new homes built in the US, Australia and New Zealand were far larger than in European economies.
In recent years a key trend in Australia has been the increasing number of apartments being built. Eight years ago around 27 per cent of homes built were apartments. Today, apartments account for almost half (41 per cent) of all homes built.
And the increased number of apartments being built has served to reduce the size of the average new home built in Australia. In fact the average home was 186.8m² in 2017/18, the lowest level in 22 years. And the average home size rose by just 1.2 per cent from these lows in the past year.
Through the 2004-2010 period, the average apartment was around 140m². Today it is closer to 125-130m².
The shift to smaller apartments may mean that more of them need to be built to house the growing population compared with free-standing houses. Clearly, when considering issues like under-supply and over-supply, a range of issues need to be considered.
An increasing number of home buyers and renters prefer to live closer to offices, restaurants and recreational facilities in cities and towns. And given the limited supply of land, increased building of apartments and townhouses is necessary to satisfy demand.
Federal, state and local governments are also embracing the trend to urban consolidation, representing a more efficient utilisation of social and economic infrastructure such as roads, schools, public transport and hospitals.
WHAT DO THE FIGURES SHOW?
Australia & US home completions
CommSec commissioned the Australian Bureau of Statistics to supply data on the average size of new homes built in Australia.
The data supplied relates to the average size of new homes built – houses, apartments and the average size of all homes. The ABS also indicates the proportion of homes built at the stated “average floor area”.
The United States Census Bureau provides both median and average estimates of new homes built and also supplies similar floor area data on new homes sold.
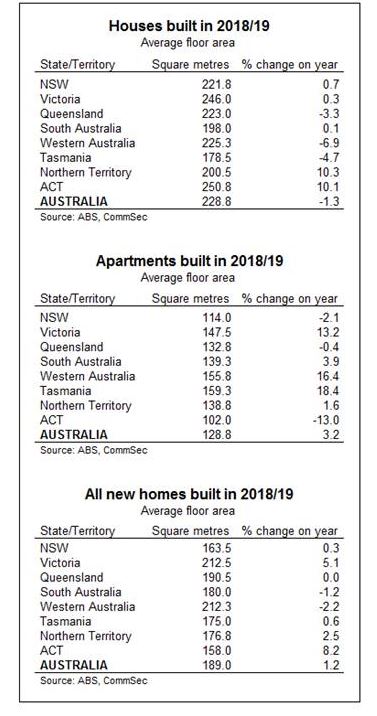
In 2018/19, the average size of a new house built in Australia was 228.8 square metres (m²), down from 231.8m² in 2017/18 and the smallest result in 17 years (since 221.2m² in 2001/02).
In the US, the average size of a new single-family house built in 2018 (latest estimate) was 2,588 square feet or 240.4m², down from a record 249.6m² in 2015. Australian houses were last bigger than US houses in 2011/12.
The average US home (houses and apartments) was 201.8m² in 2018.
In 2018/19 the average floor area of a new apartment in Australia (unit, townhouse, villa etc.) was 128.8m², up from 124.8m² in 2017/18 but 10 per cent below the high of 143.4m² in 2004/05.
States & territories
The ACT is building the biggest houses in Australia. In 2018/19 the average floor area of a house built in the ACT was 250.8m², ahead of Victoria (246.0m²), Western Australia (225.3m²), and Queensland (223.0m² – a 21-year low).
The smallest new houses built were in Tasmania (178.5m² – a 23-year low).
By contrast, in 2018/19 the biggest apartments could be found in Tasmania (159.3m²) followed by Western Australia (155.8m²). The next biggest apartments were built in Victoria (147.5m²) and South Australia (139.3m²)
The smallest new apartments can be found in the ACT (102m²) and NSW (114m² - a 20-year low).
Of all homes built in 2018/19, the average floor area was biggest in Victoria (212.5m²), then Western Australia (212.3m²). In Western Australia over 75 per cent of homes built were free-standing houses, and in Victoria houses were 56 per cent of the total. By comparison, only around 43 per cent of homes built in NSW were free-standing or detached houses in 2018/19 and only 21 per cent of ACT homes.
HOME SIZE PEAKS, MORE APARTMENTS, OCCUPANCY FALLS AGAIN
Since the first Census was conducted in 1911, and up to 2006, the number of persons per dwelling consistently fell. In 1911 there was an average of 4.5 people in every home. But by 2006 this ratio had almost halved to around 2.4 people in every home. Not only were more homes being built but other factors like families with fewer children, more divorces and fewer marriages taking place had resulted in smaller families.
And as noted above, homes had been getting bigger until a few years ago. Apart from floor area, another way of looking at home size is the number of bedrooms. In the 2016 Census almost a third of homes had four or more bedrooms whereas 20 years ago the ratio was one in every six homes.
Census figures are only produced every five years. But fortunately demographic estimates are produced each quarter and they provide a guide to current trends in dwelling occupancy.
From 2006 to 2013, the number of people per dwelling rose. At face value, the modest increase in average household size may not seem significant. But it was the first increase in household size – and as a consequence, the average number of people in Australian homes – in at least a century.
Children were staying home longer with their parents – no doubt the cost of homes and rising rents being key influences. With the ageing population, more generations were choosing to stick together in the one dwelling – a trend that is a consequence of the increased size and quality of homes. New migrants also chose to stay with family or friends. And given the increased preference to attend universities and colleges, Generation Y was forced to share accommodation and save longer to buy a home.
According to quarterly ABS data, since 2014 the number of people per dwelling has been falling. Lower interest rates and the increased supply of cheaper apartments and townhouses (compared with free-standing houses) have prompted older couples to down-size. And more Generation Y / Millennials have been moving out of home and renting or taking ownership of accommodation more appropriate to their needs.
In part, the decline in household size explains some of the lift in home building. Higher population growth – especially in NSW, Victoria and the ACT – also explains the lift in home building. The question is whether household size continues to fall over the next few years or whether higher home prices act to stall demand, again prompting greater co-habitation of dwellings.
Free-standing houses now account for just over half of all new homes built with high-rise apartments and townhouses most in demand.
WHAT ARE THE IMPLICATIONS FOR INTEREST RATES AND INVESTORS?
Australians continue to build some of the biggest houses in the world. But an increasing proportion of Australians – especially in Sydney and Canberra – also want smaller homes like apartments, semi-detached homes and townhouses. As a result, the average home size has been falling over the past decade.
Generation Y, Millennials, ‘down-sizers’ and small families want to live closer to work, cafes, restaurants, shopping and airports and have been giving up living space for better proximity to the desirable amenities.
So urban consolidation continues. Older free-standing houses are making way for apartments. Building completions hit record highs in the year to March 2017, and have hovered near the highs in the period since. New council approvals to build homes have eased substantially from highs but there is still a substantial amount of work to be done.
It is important to note that there are major differences in house size across Australia. In 2018/19 only 21 per cent of ACT dwellings completed were houses, but those houses were the biggest in the nation and the biggest for the ACT in 11 years. Victoria built the second biggest houses in the nation and the biggest for the state in seven years. By contrast the average new free-standing house built in NSW was 10 per cent smaller than Victoria.
Clearly the changes in housing demand and supply, and the differences across the country, have major implications for builders, developers, investors, building material companies, financiers and all levels of Government. With the average number of people in homes falling and population rising, there is on-going need for a greater number of smaller homes to be built.
Article courtesy Property Observer 10th November 2019
| Quiet simply, the Palms is the place to buy! |
Sydneysiders and Melburnians, put aside your equally outstanding flat whites for a moment. Stop bickering about whether great beaches beat cool laneways (they do) and desist from debating whether all baristas require waxed moustaches (ideally).
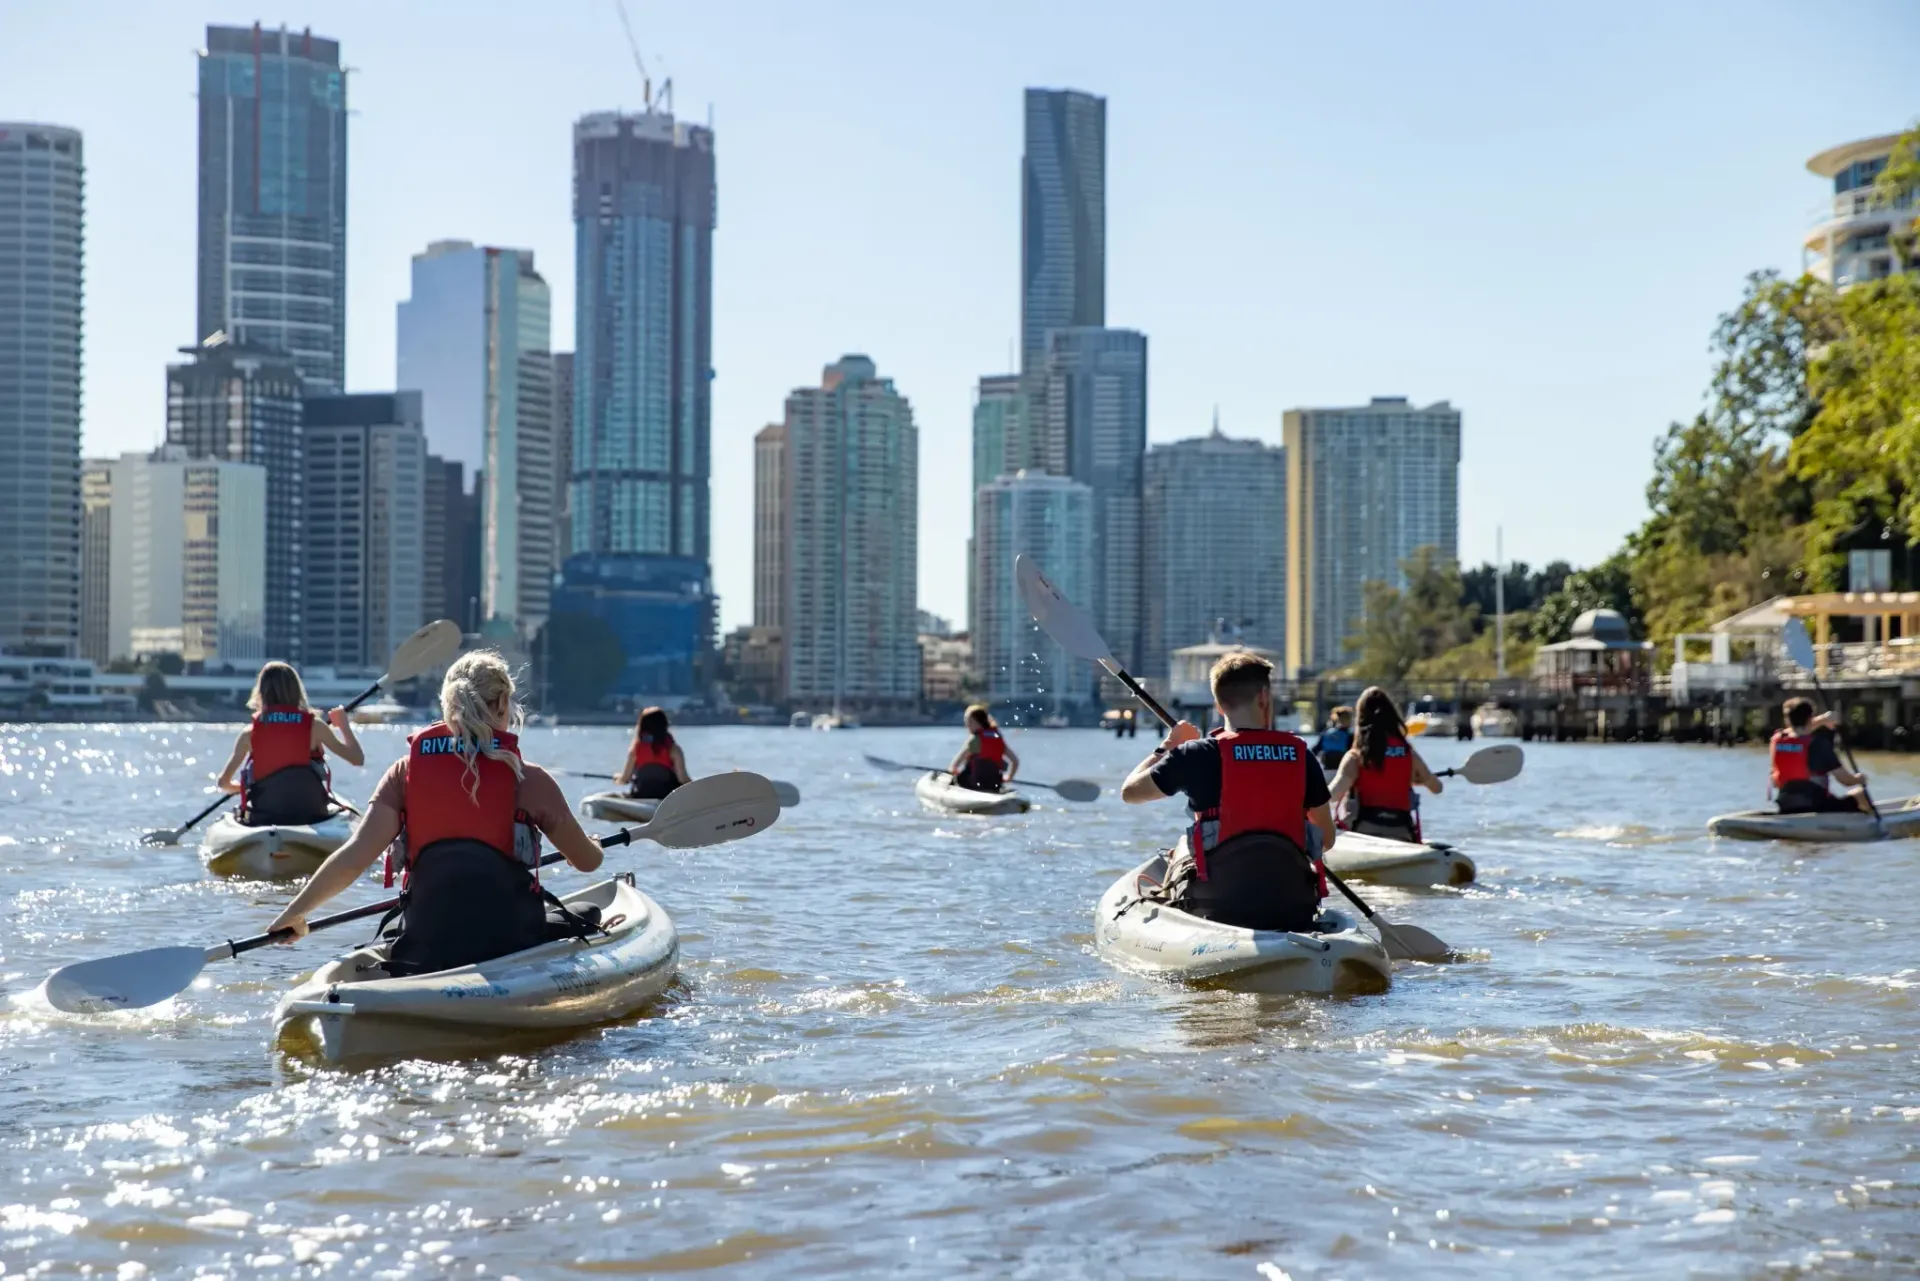
Because Brisbane is closing in on the title of Australia’s best city, and we must join forces to keep this subtropical upstart in its place.
Time magazine recently named Brisvegas on its “World’s Greatest Places” list, and omitted our cities. It’s a huge shock (and who knew they still published Time magazine?). But they might be onto something.
Time points to the 2032 Olympic and Paralympic Games, which will be hosted in the maroon metropolis. Brisbane will do a fine job, even though it’ll baffle the world when rugby league is added to the schedule and Queensland is allowed to field its own team.
Time’s most radical claim is that Brisbane is worth visiting now, but tourism is surging. Not only did Lin-Manuel Miranda recently drop in to catch Hamilton , but hundreds of Hamilfans flew up to watch his interview with Leigh Sales (presumably unaware that it would subsequently arrive on iView for free).
A leading local agent has appraised each side of these duplex's to be worth $665k on completion and rent for $495 per week. So that is massive potentail instant equity of up to $390K on completion, which is incredibly hard to find.